

A price increase on a frequently purchased item can slip through one invoice. A missed delivery can force a location to make a last-minute substitution. Across dozens or hundreds of locations, small problems like these add up quickly.
Supply chain KPIs help operators see where those problems are happening and whether they’re isolated incidents or patterns that need attention. The right metrics show more than what you spent last month. They help you understand whether contracted prices are holding, suppliers are delivering what you ordered, and restaurants have the products they need to serve guests.
Here are 12 foodservice supply chain KPIs worth tracking, along with practical ways to put the numbers to work.
Why Supply Chain KPIs Are Critical for Foodservice Operators
Foodservice supply chains move quickly. Prices change, demand shifts, deliveries arrive short, and a product that was available yesterday may be difficult to find tomorrow. When purchasing, inventory, and supplier information live in separate systems, it can take too long to see what’s happening across the business.
Supply chain KPIs give operators a consistent way to spot changes. A rising stockout rate may point to a forecasting issue, a supplier constraint, or a problem with replenishment. An increase in purchase price variance may reveal a market change or an invoice that needs a closer look. Each metric gives your team a place to start asking better questions.
That matters especially for multi-location brands. A problem at one restaurant may be easy to dismiss. The same problem across a region deserves a response.
How to Choose the Right Supply Chain KPIs
You don’t need every available metric on your dashboard. Start with the questions your team needs to answer and choose KPIs that help you make decisions.
Align KPIs With Business Goals
If protecting margins is the priority, focus on pricing, contract compliance, spend, and food cost variance. If locations are struggling to keep core menu items available, look closely at fill rate, stockouts, lead time, and delivery performance.
The goal is to connect each KPI to an outcome. Before adding a metric, ask: What would we do if this number changed?
Use Consistent Data Across Locations
A comparison only works when everyone is measuring the same thing. Define which products, suppliers, locations, and time periods each KPI includes. Standardize product names and units of measure, and decide how substitutions, credits, and canceled orders will be handled.
For example, one location might count a substituted case as a filled order while another counts it as a short. Without a shared definition, their fill rates tell two different stories.
Focus on Actionable Metrics
A useful KPI should help someone investigate an issue or make a change. It should also have an owner. If contract price compliance drops, who reviews the affected invoices? If stockouts rise, who checks demand, distributor inventory, and ordering patterns?
Keep the dashboard focused on numbers your team can act on, then make room to investigate what’s behind them.
12 Supply Chain KPIs Every Foodservice Operator Should Track
1. Purchase Price Variance
Purchase price variance shows how much the price you paid differs from a selected benchmark, such as your contracted price or a prior-period price.
How to measure it: Subtract the benchmark unit price from the actual unit price, then multiply by the quantity purchased. You can also express the difference as a percentage of the benchmark price.
Choose the benchmark carefully. A comparison to last month can reveal a cost change, while a comparison to your contract can flag a potential pricing issue. Check pack sizes and units of measure before treating a difference as an overcharge.
2. Contract Price Compliance
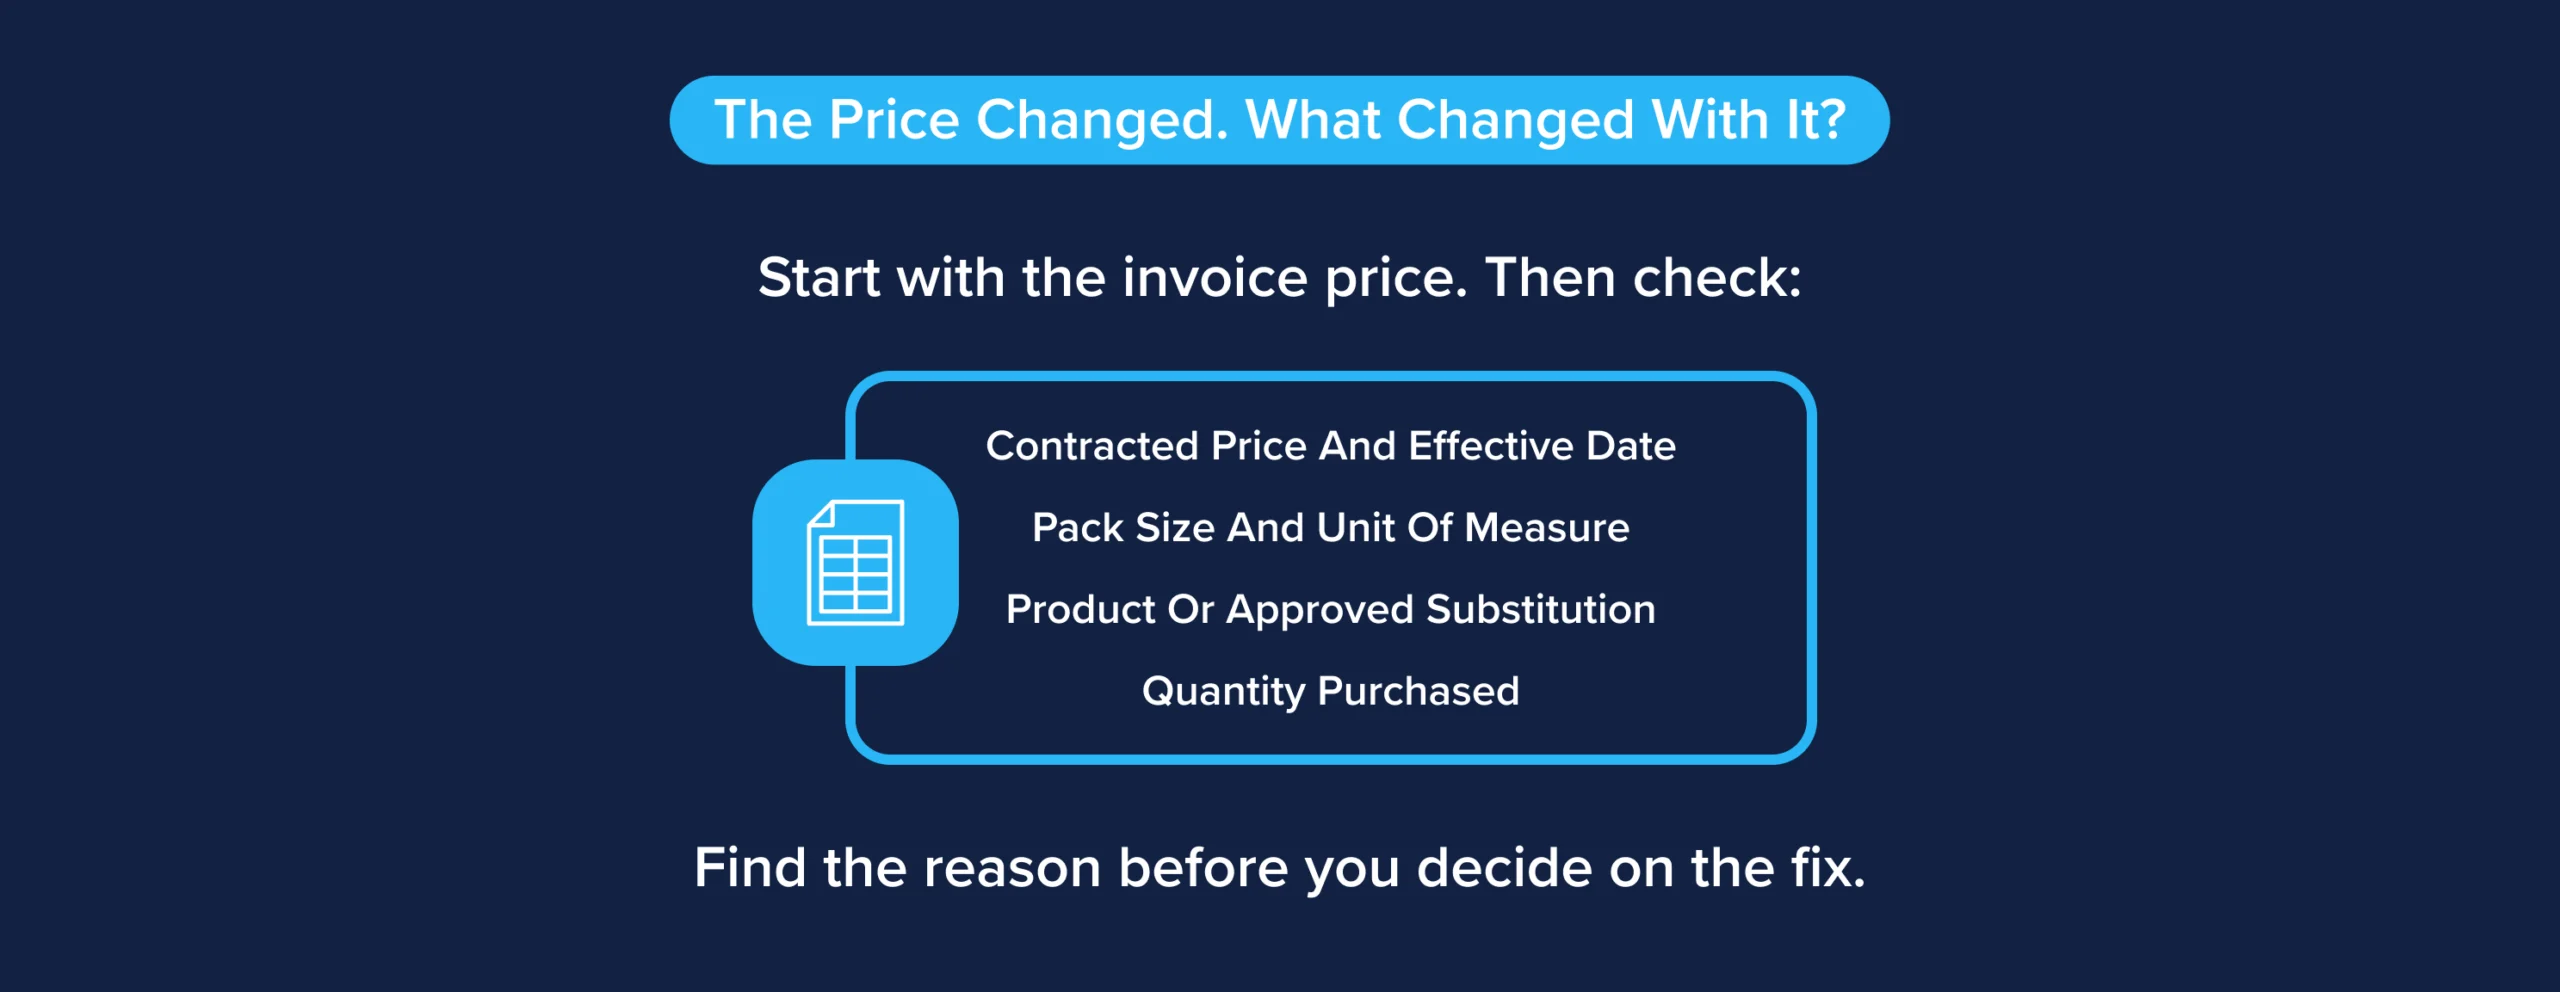
Contract price compliance measures how often invoiced prices match the prices and terms in your agreements.
How to measure it: Divide the number of eligible invoice lines billed according to contract terms by the total number of eligible invoice lines, then multiply by 100.
Review exceptions by distributor, product, and location. A single incorrect price applied across a large network can have more impact than several one-off discrepancies.
3. Supplier Fill Rate
Supplier fill rate shows how much of the quantity ordered was supplied.
How to measure it: Divide the quantity supplied by the quantity ordered, then multiply by 100. Track substitutions separately so they don’t hide shortages of the products your restaurants expected.
An overall fill rate can look healthy while a small set of menu-critical items remains hard to get. Review those items on their own.
4. On-Time Delivery Rate
On-time delivery rate measures the share of deliveries that arrive within the agreed delivery window.
How to measure it: Divide on-time deliveries by total scheduled deliveries, then multiply by 100. Set the delivery window with your distribution partners before comparing results.
A delivery that arrives after prep begins can create problems even if it lands on the promised day. For many restaurants, the time of arrival matters as much as the date.
5. Order Accuracy Rate
Order accuracy rate measures whether the products and quantities delivered match the order.
How to measure it: Divide orders received without errors by total orders received, then multiply by 100. Define whether the metric includes incorrect items, damaged cases, unapproved substitutions, and quantity discrepancies.
Pair this KPI with issue records from your locations. They can show which errors create the most work for restaurant teams.
6. Inventory Turnover
Inventory turnover shows how often inventory is used and replaced during a given period.
How to measure it: Divide cost of goods used during the period by average inventory value for that period.
A low turnover rate may point to excess stock, slow-moving products, or ordering that hasn’t kept pace with demand. A high rate may be efficient, but only if locations can still maintain availability. Compare similar products and operating models rather than relying on one network-wide target.
7. Stockout Rate
Stockout rate measures how often a product is unavailable when a location needs it.
How to measure it: Divide recorded stockout events by the total product availability opportunities you’re tracking, then multiply by 100. Define an “opportunity” consistently, such as a location-item-day or an attempted order line.
Track high-volume and menu-critical products separately. A stockout of an occasional special and a stockout of a core ingredient have very different effects on service.
8. Lead Time
Lead time is the time between placing an order and receiving the product.
How to measure it: Calculate the elapsed time from order placement to receipt, then review the average and the range by product or supplier.
The average alone can be misleading. If an item usually arrives in three days but occasionally takes eight, your ordering team needs to plan for that variability. Watch for changes before they turn into stockouts.
9. Supplier Performance
Supplier performance brings several measures together to show how reliably a supplier supports your business.
How to measure it: Build a scorecard using the factors that matter to your operation, such as fill rate, on-time delivery, quality incidents, issue resolution, and responsiveness. Apply the same scoring rules to suppliers serving similar needs.
A scorecard makes conversations more specific. Instead of saying service has declined, you can show where performance changed, which locations were affected, and what improvement looks like.
10. Spend by Supplier and Category
Spend by supplier and category shows where purchasing dollars are going.
How to measure it: Group purchase data by supplier, product category, location, and time period. Review total spend and each group’s share of overall spend.
This view can reveal purchasing shifts, fragmented buying, or categories that deserve a contract review. When spend increases, look at both price and volume before deciding what caused it.
11. Supplier Concentration
Supplier concentration shows how much of your purchasing depends on a small number of suppliers.
How to measure it: Divide spend with a supplier, or with your top group of suppliers, by total spend in the relevant category, then multiply by 100.
Concentration is not automatically a problem. It can support consistency and purchasing efficiency. The question is whether you have a workable plan if a key supplier cannot meet demand, particularly for products with limited approved alternatives.
12. Food Cost Variance
Food cost variance shows the difference between expected food cost and actual food cost.
How to measure it: Subtract expected food cost from actual food cost for the same period, using a consistent definition of each.
Purchasing prices are one possible cause of a variance, but they aren’t the only one. Waste, portioning, sales mix, recipe changes, and inventory accuracy can also affect the result. Use food cost variance as a signal to investigate, then connect it with purchasing and inventory data to narrow down the cause.
How to Measure Foodservice Supply Chain KPIs
Start by agreeing on the definition, data source, owner, and review frequency for each KPI. Then bring the information together: purchase orders, contracts, distributor invoices, delivery records, inventory data, and location-level issue reports may all be needed to see the full picture.
Before calculating trends, clean up the basics. The same item may appear under different distributor descriptions or pack sizes. A price comparison can be wrong if one record refers to a case and another refers to an individual unit. Supplier and location names also need to be consistent.
Finally, look beyond the network average. Break results down by region, distributor, location, category, and product where useful. A strong overall score can conceal a persistent issue affecting a handful of restaurants.
How to Use Supply Chain KPIs to Improve Performance
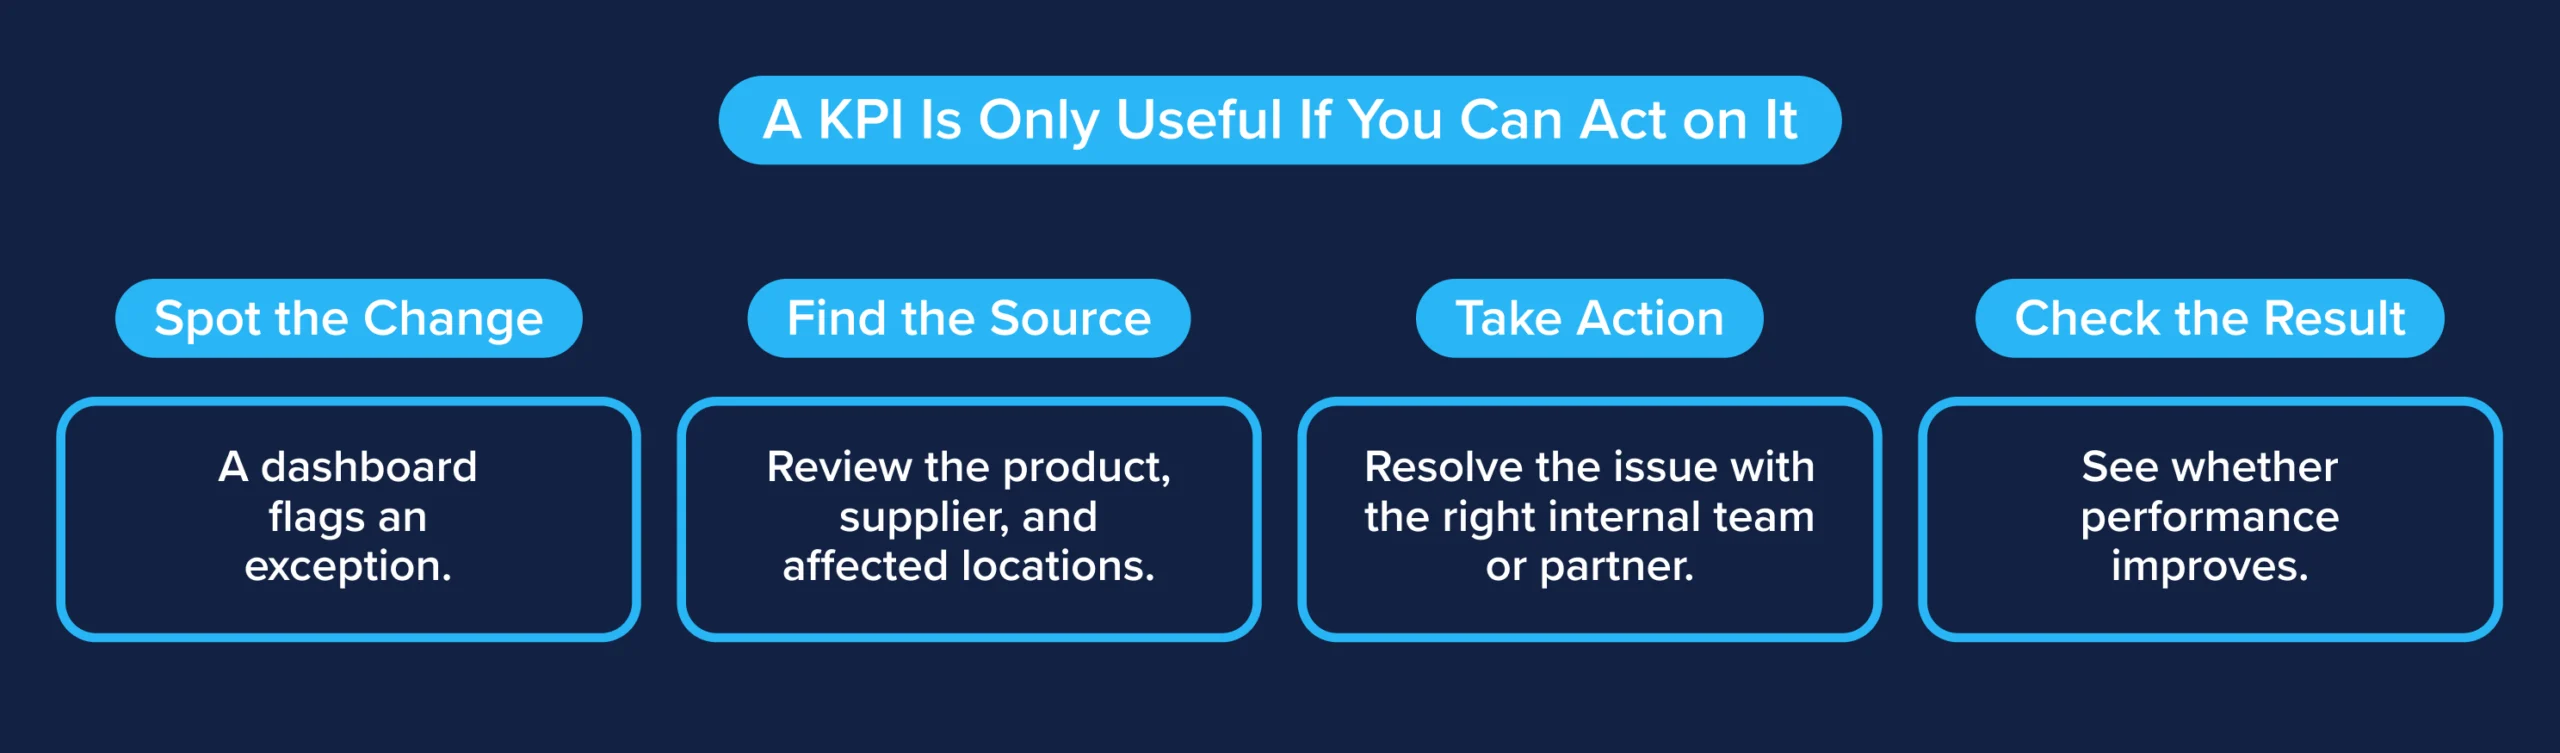
The value of a KPI comes from what your team does after it changes. Build a regular review around the exceptions that matter most, assign follow-up, and check whether the action improved the result.
Identify Supplier Performance Issues
Look for recurring shortages, late deliveries, substitutions, or quality incidents tied to a supplier or distribution center. Bring specific examples to the conversation: affected items, locations, dates, and the operational impact. That gives both teams a clearer path to a solution.
Detect Purchasing Cost Changes
Review price variance alongside contract terms, purchasing volume, and product substitutions. An unexpected increase might be a valid market adjustment, a change in the item purchased, or a billing error. Separating those causes helps your team respond appropriately.
Identify Inventory and Availability Risks
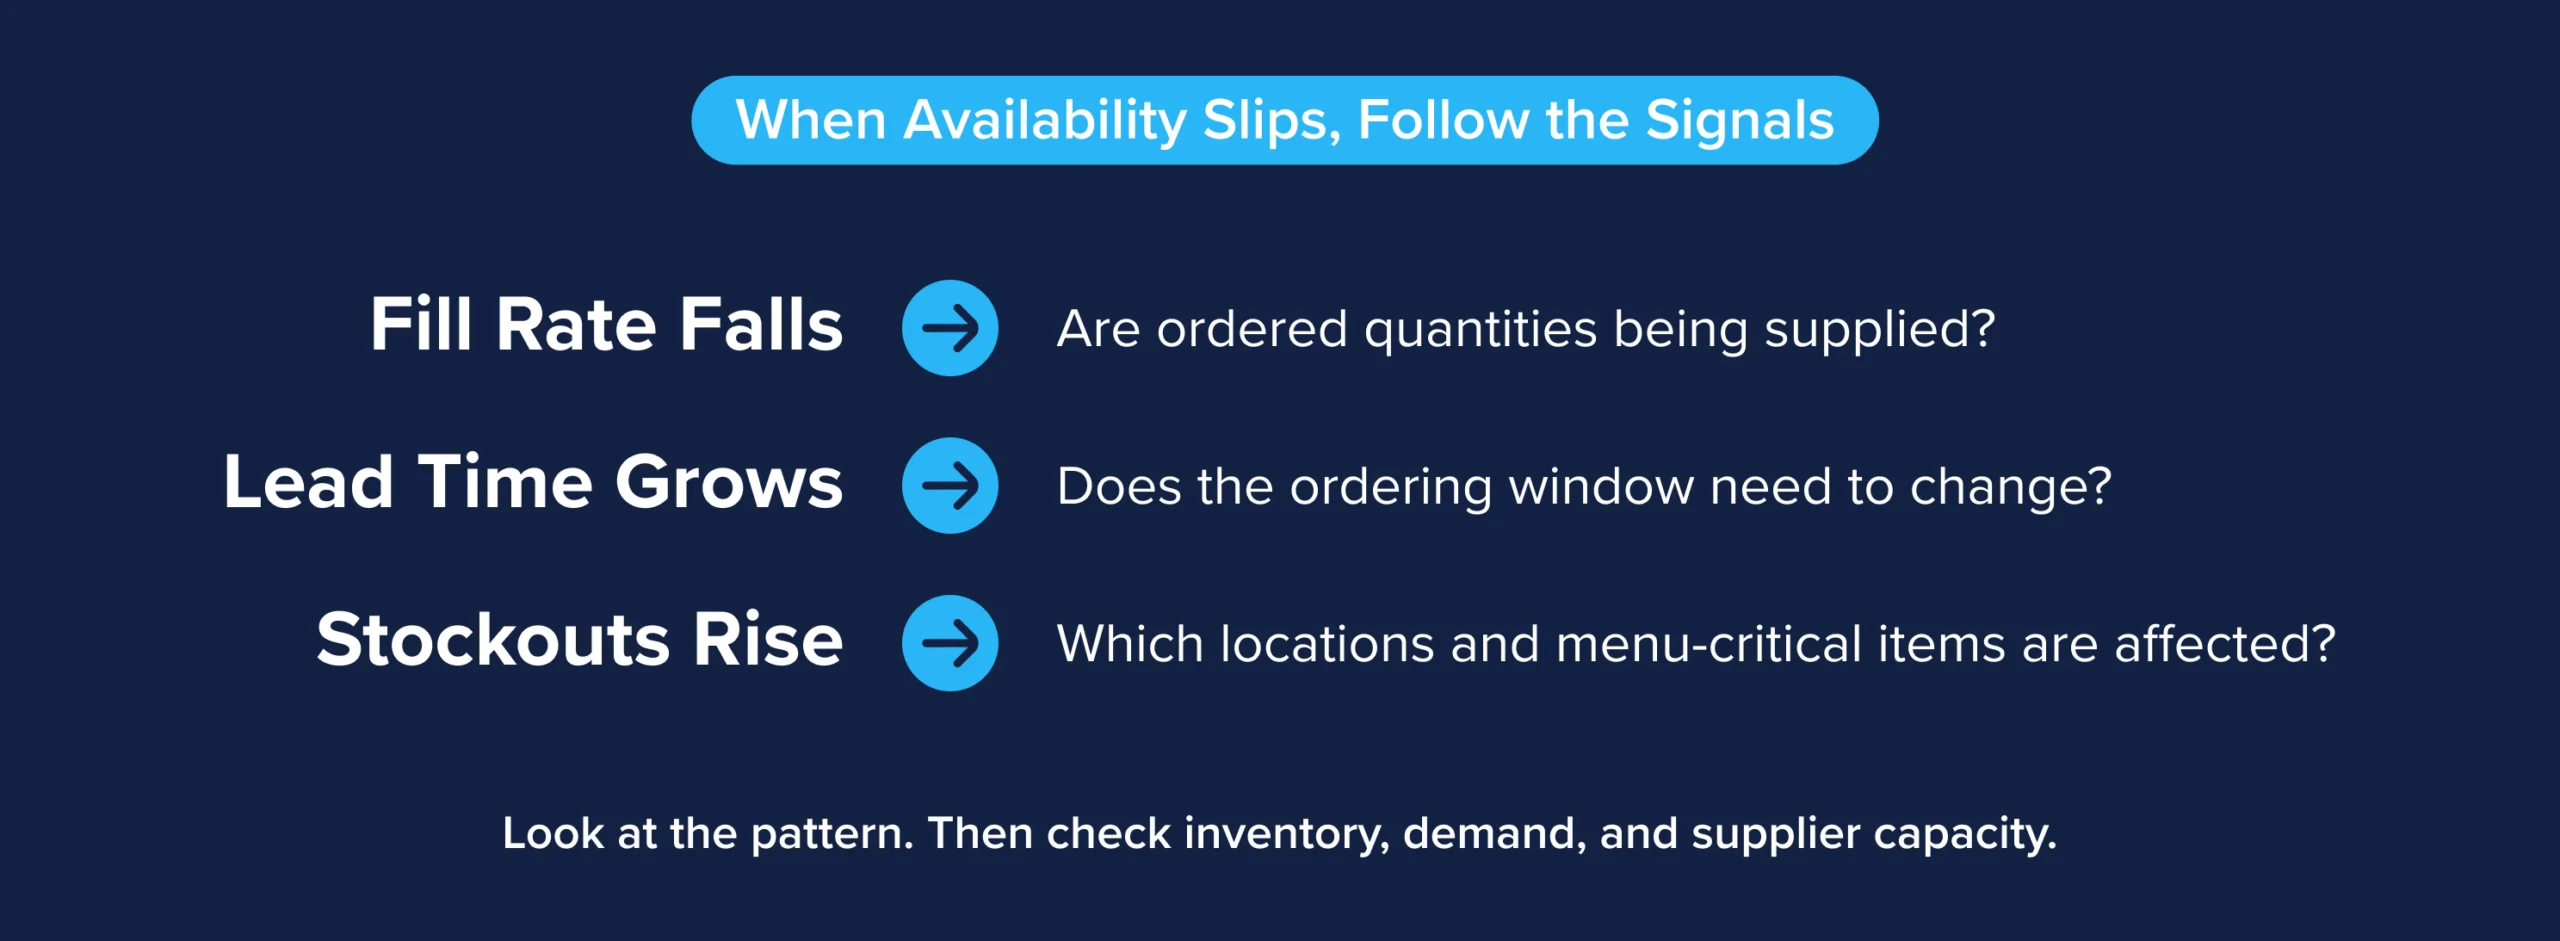
Use stockout rates, lead times, and fill rates together. If lead times are growing while fill rates fall, a menu-critical item may need closer monitoring or an approved backup. If stockouts rise despite reliable deliveries, review ordering patterns and location demand.
Compare Performance Across Locations
Location-level comparisons can reveal where a process is working and where teams need support. If similar restaurants have very different off-contract purchasing or stockout rates, investigate the reason before setting a blanket target. Menu mix, delivery schedules, and local demand can all affect the numbers.
How Technology Helps Operators Track Supply Chain KPIs
Tracking supply chain KPIs gets harder when contract terms, invoices, inventory records, and location data live in different places. Your team may spot a cost increase or a shortage, but still have to piece together which products, suppliers, and restaurants are affected before they can act.
ArrowStream Central brings location, supplier, and product data into one platform. Dashboards and customizable reports help operators follow the KPIs that matter to their business, while targeted analytics make it easier to see trends across locations. Teams can compare invoice prices against contracted terms, monitor distributor inventory for potential stockouts and substitutions, and track quality or service issues reported by restaurants.
That shared view gives buying, procurement, and distribution teams more useful conversations with suppliers and distributors. When a KPI changes, they can get closer to the cause and decide what needs attention before the issue spreads across the network.
How Often Should Foodservice Operators Track Supply Chain KPIs?
The right cadence depends on how quickly a metric can change and how urgently your team needs to respond.
Review stockouts, critical-item availability, and major delivery issues daily or as they occur. Look at fill rate, order accuracy, price exceptions, and supplier performance weekly. Use monthly reviews for broader trends in inventory turnover, category spend, concentration, and food cost variance.
A quarterly review is useful for stepping back: Are the same issues recurring? Have corrective actions worked? Do your targets or supplier plans need to change? Set alerts for urgent exceptions so they don’t wait for the next scheduled meeting.
Final Thoughts
Supply chain KPIs give operators a clearer view of what’s happening between the purchase order and the restaurant. They can expose a pricing discrepancy, show where supply is becoming less reliable, or reveal a purchasing pattern worth revisiting.
Start with the measures tied to your biggest business goals. Define them consistently, review them with the right people, and use what you learn to make specific changes. If your team needs a clearer view across locations, suppliers, contracts, and products, connect with an ArrowStream expert to see how connected supply chain data can support those decisions.
FAQs
What Are Supply Chain KPIs?
Supply chain KPIs are measures used to track how well purchasing, suppliers, distribution, and inventory are supporting your operation. In foodservice, they can help teams monitor costs, product availability, delivery reliability, and contract compliance.
What Are the Most Important Supply Chain KPIs for Foodservice Operators?
The most useful KPIs depend on your goals. Contract price compliance and purchase price variance help monitor costs, while supplier fill rate, on-time delivery, and stockout rate help track availability. Multi-location operators should also look at results by location and supplier.
How Do You Measure Supply Chain Performance in Foodservice?
Bring together purchasing, invoice, contract, delivery, and inventory data. Define each metric consistently, calculate it over a set period, and compare results by supplier, product, and location. Investigate exceptions alongside restaurant-level feedback.
What Is the Difference Between OTIF and Supplier Fill Rate?
Supplier fill rate measures how much of the ordered quantity was supplied. OTIF, or on time in full, measures whether an order arrived within the agreed delivery window and contained the full expected quantity. A supplier can have a high fill rate and still miss OTIF if deliveries arrive late.
How Often Should Foodservice Operators Track Supply Chain KPIs?
Monitor urgent availability and delivery issues as they happen. Review operating measures such as fill rate and pricing exceptions weekly, then assess broader cost, inventory, and supplier trends monthly or quarterly.
How Can Supply Chain KPIs Improve Purchasing and Cost Control?
They help teams find where actual prices differ from expectations, where off-contract buying occurs, and where ordering or inventory practices may be driving unnecessary cost. The biggest gains come from investigating those differences and following through on the findings.