
Foodservice operators make thousands of purchasing decisions every day. A single transaction may look routine: cases are ordered, products arrive, an invoice is paid, and service continues. Across hundreds of products, multiple suppliers, and dozens or even hundreds of locations, however, those transactions tell a much bigger story.
Spend analysis helps operators read that story. It brings purchasing data together so teams can see where money is going, how closely locations are following contracts, where prices differ, and which opportunities deserve attention first. Instead of relying on assumptions or reviewing costs only after margins tighten, operators can use their own data to make more informed purchasing and supply chain decisions.
For multi-unit restaurant brands, visibility is especially important. Small price differences, off-contract purchases, and inconsistent product choices can compound quickly across the system. A consistent spend analysis process gives finance, procurement, culinary, and operations teams a shared view of purchasing performance and a clearer path to better cost control.
What Is Foodservice Spend Analysis?
Foodservice spend analysis is the process of collecting, organizing, and evaluating purchasing data to understand how an operation spends money on food, beverages, supplies, equipment, and other goods or services.
At a basic level, it answers questions such as:
- What are we buying?
- How much are we spending?
- Which suppliers receive that spend?
- What prices are individual locations paying?
- Are purchases aligned with approved products and contracts?
- Where are costs, volumes, or buying patterns changing?
The real value of spend analysis comes from connecting these answers. Knowing total protein spend is helpful. Knowing which protein items are driving an increase, whether the change comes from price or volume, which suppliers and locations are involved, and whether contracted terms were applied is far more actionable.
Spend analysis is not the same as simply reviewing a profit-and-loss statement or comparing monthly totals. Financial reports show what happened at a high level. Spend analysis goes deeper into transaction, item, supplier, contract, category, and location data to help teams understand why it happened and what they can do next.
Why Spend Analysis Matters for Foodservice Operators
Foodservice purchasing is rarely static. Commodity markets move. Supplier costs change. Menus evolve. Locations substitute products. New contracts take effect, and temporary purchasing decisions have a habit of becoming permanent. Without regular visibility, the gap between the way a program was designed and the way locations actually buy can widen over time.
Spend analysis helps operators find those gaps before they become accepted costs of doing business. It can uncover inconsistent pricing, missed contract terms, fragmented supplier spend, specification drift, and purchases that fall outside approved programs. It also creates a stronger foundation for sourcing events, supplier negotiations, budgeting, forecasting, and menu planning.
For procurement teams, the benefit is sharper prioritization. Not every variance deserves the same response. A large price difference on a high-volume item may warrant immediate review, while a one-time variance on a low-spend product may not. Spend analysis allows teams to focus their time where the financial impact is greatest.
It also supports better conversations across departments. Finance can see the cost impact. Operations can see location behavior. Supply chain teams can evaluate supplier performance. Culinary leaders can assess whether product changes are practical. Everyone works from the same facts instead of a collection of separate spreadsheets and competing explanations.
What Data Is Used in Foodservice Spend Analysis?
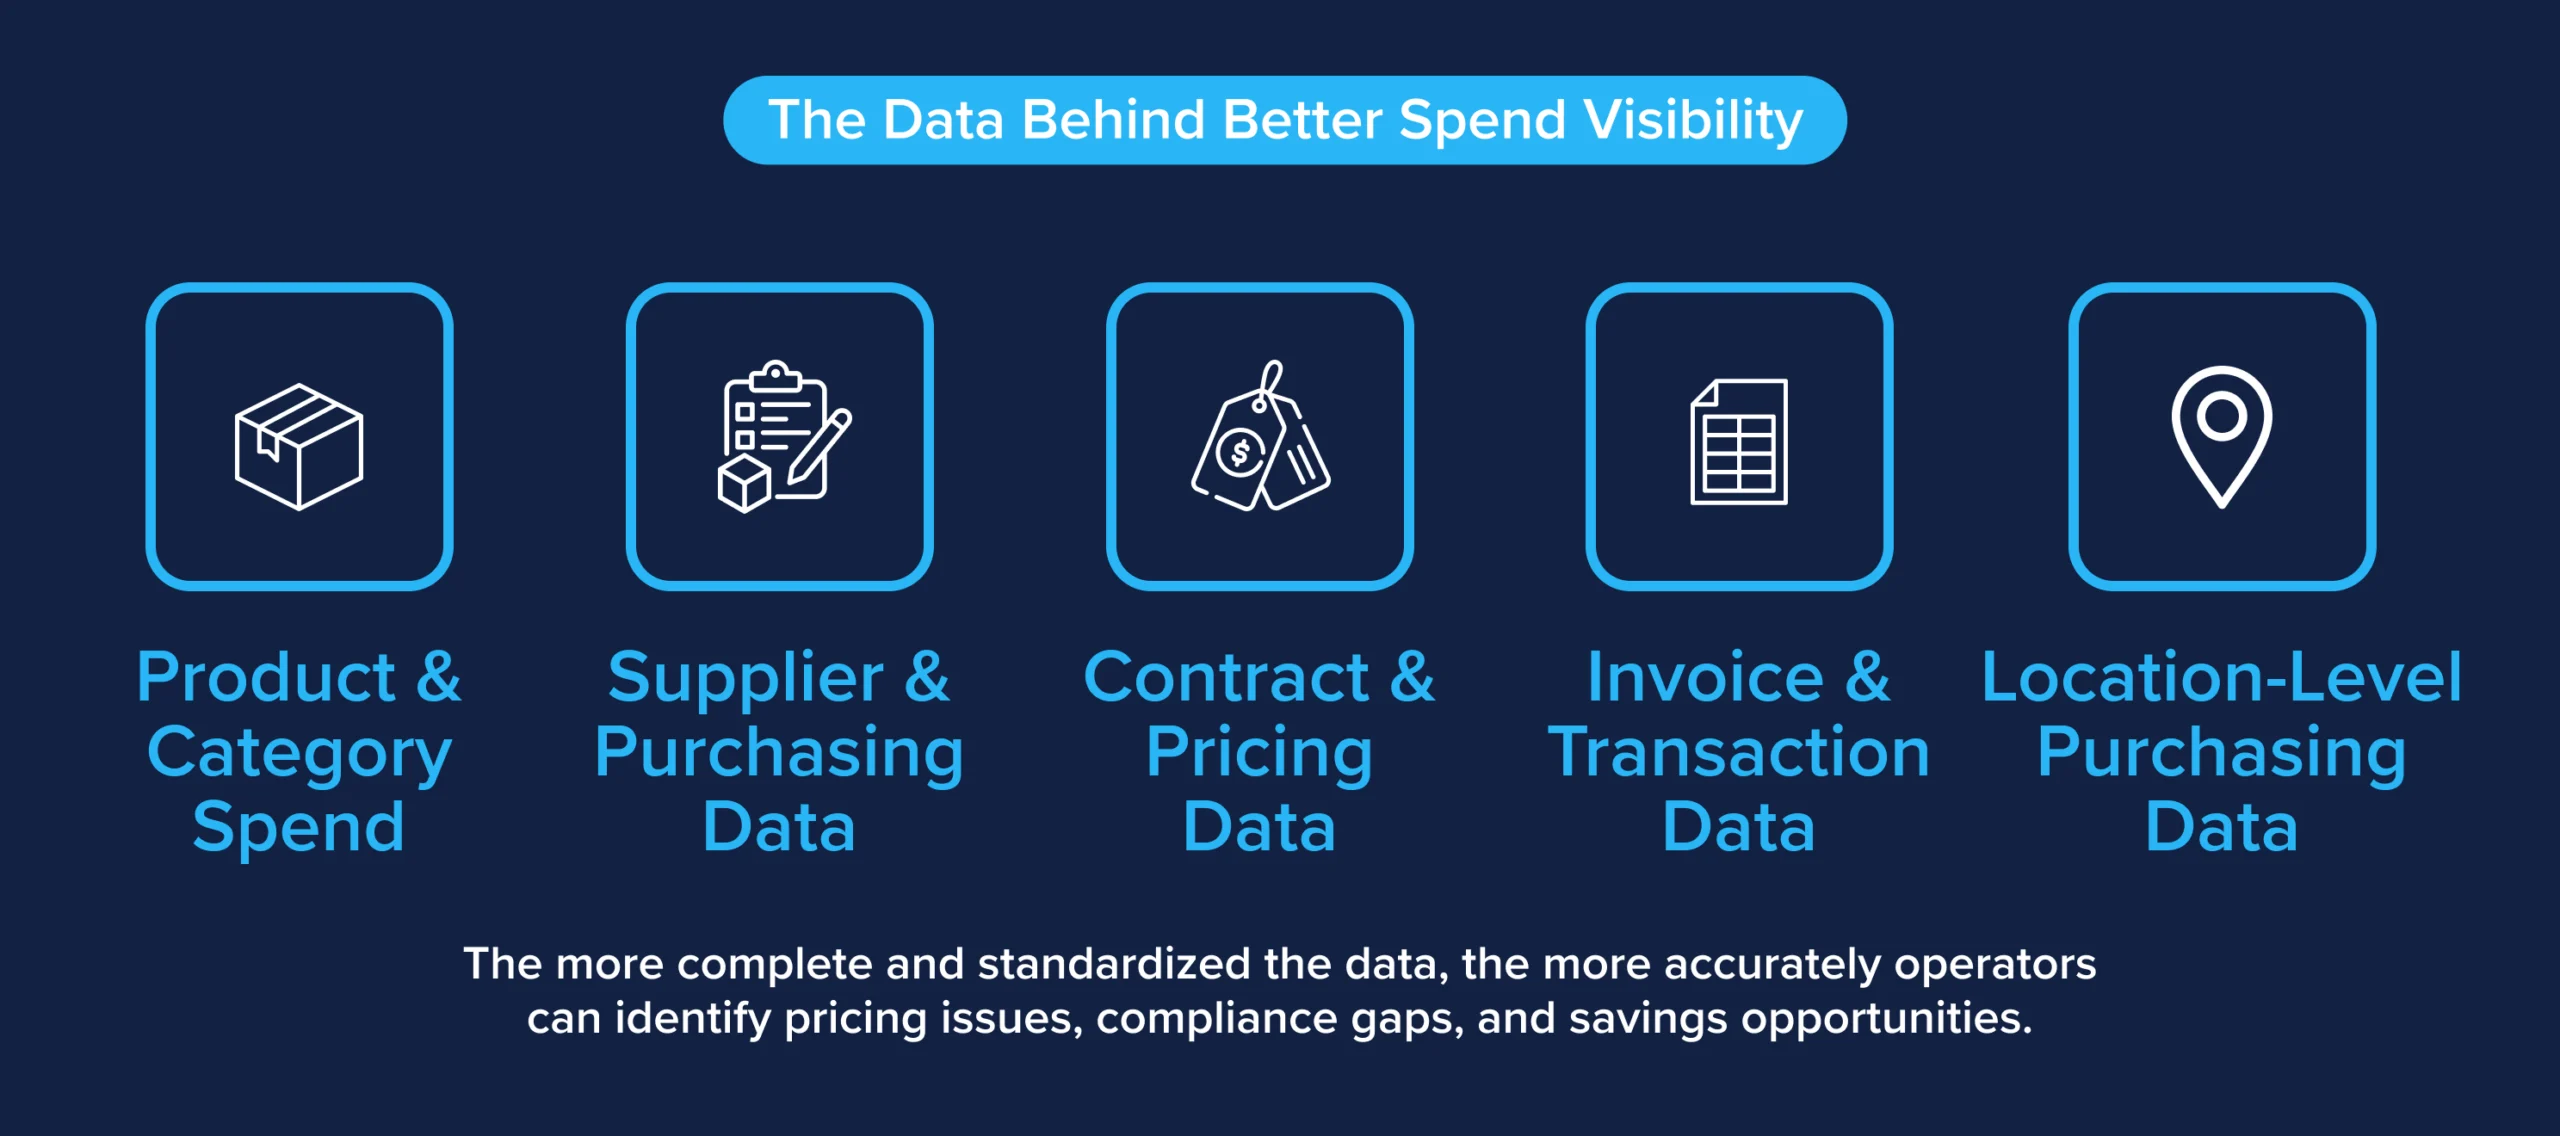
Useful spend analysis depends on both the quality and range of the data behind it. A total-spend figure alone provides very little context. Operators need enough detail to follow purchasing activity from the enterprise level down to a supplier, location, invoice, or individual item.
Product and Category Spend
Product-level data shows what an organization is buying, in what quantities, and at what cost. It typically includes product descriptions, item numbers, brands, pack sizes, units of measure, purchase volume, and extended spend.
Grouping those products into categories makes the information easier to evaluate. Teams can compare spend across areas such as proteins, produce, dairy, disposables, beverages, chemicals, and smallwares. From there, they can identify the categories responsible for the largest cost movements and examine the products behind them.
Supplier and Purchasing Data
Supplier data connects purchases to distributors, manufacturers, and other vendors. It helps operators understand how much business is concentrated with preferred partners, where spend is fragmented, and whether different locations are buying comparable items from different sources.
This view can also reveal duplicate supplier relationships or categories in which purchasing volume is spread too thinly to create meaningful leverage. Supplier spend does not automatically indicate an opportunity, but it gives procurement teams a practical place to investigate.
Contract and Pricing Data
Contract data provides the benchmark needed to determine whether purchasing activity matches negotiated agreements. Relevant information may include contracted prices, allowances, rebates, deviated pricing, effective dates, approved products, freight terms, and other commercial conditions.
By comparing actual transactions with contract terms, spend analysis can identify pricing discrepancies, purchases made after an agreement expired, missed allowances, or products bought outside an approved program. This is where spend visibility begins to translate into contract accountability.
Invoice and Transaction Data
Invoices contain the line-level detail required for a reliable spend analysis. Invoice dates, item numbers, quantities, unit prices, credits, substitutions, and fees help teams reconstruct what was actually purchased and paid for.
Looking only at summarized accounting data can hide important differences. For example, total spend may rise because prices increased, because locations purchased more cases, because the mix shifted toward higher-cost products, or because fees were added. Transaction data helps separate those causes.
Location-Level Purchasing Data
Location data shows how purchasing behavior varies across a restaurant system. Operators can compare prices, volumes, product mix, supplier use, and contract compliance by unit, region, concept, franchise group, or operating division.
These comparisons need context. A coastal location and a landlocked location may have legitimate freight or availability differences. A high-volume urban restaurant will not necessarily buy like a smaller suburban unit. The purpose of location-level spend analysis is not to assume every difference is a problem. It is to identify differences, understand what is driving them, and determine which ones call for action.
How to Conduct a Foodservice Spend Analysis
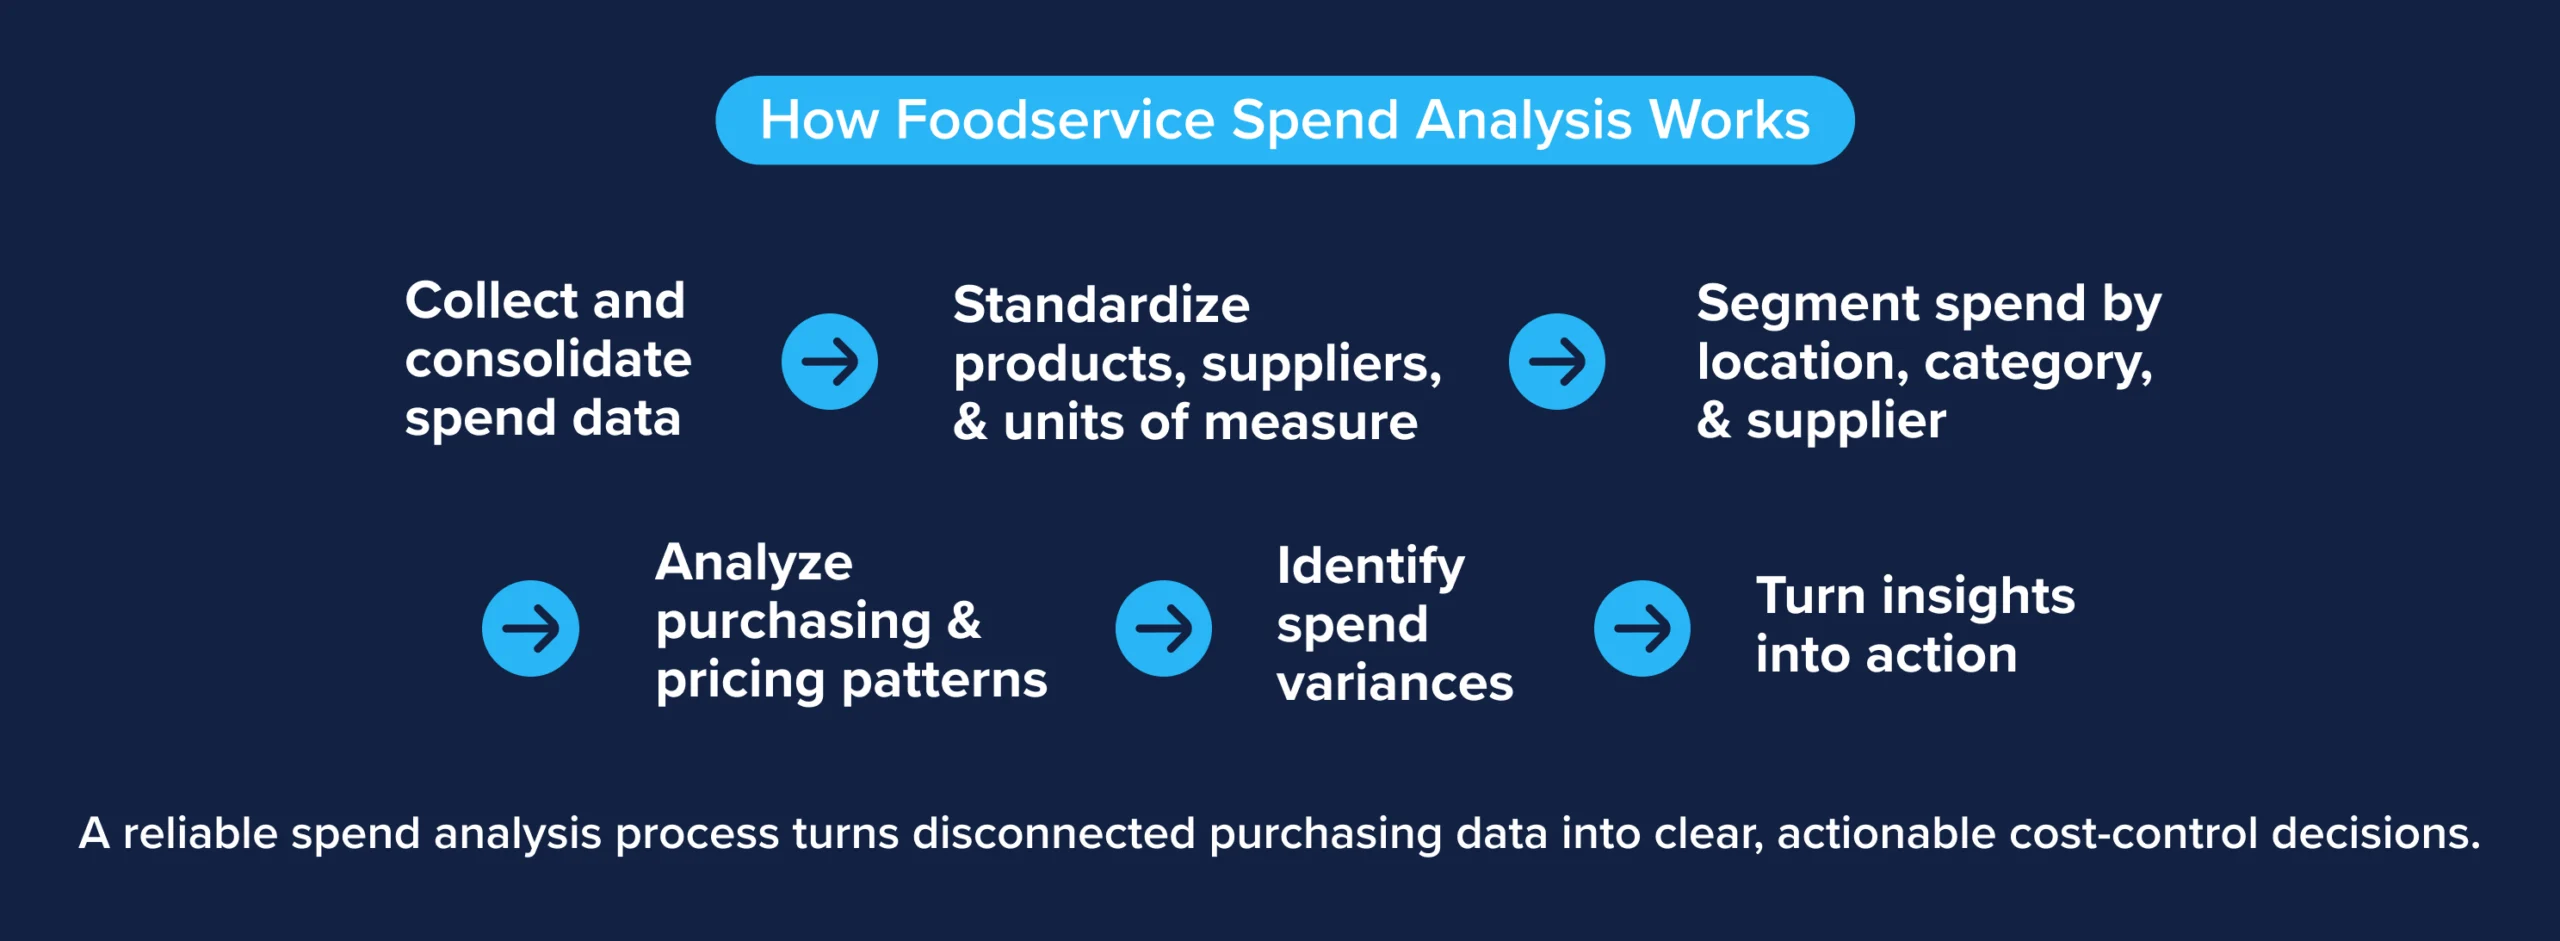
A useful spend analysis is built in stages. The work begins with collecting the right data, but it cannot stop there. Data must be cleaned, structured, segmented, and evaluated before it can support a purchasing decision.
Collect and Consolidate Spend Data
Start by gathering purchasing records from the systems and partners that hold them. Sources may include distributors, suppliers, accounts payable platforms, invoice systems, enterprise resource planning tools, restaurant management systems, and contract repositories.
The goal is to create one dependable view of spend across the organization. For a multi-unit operator, that often means combining data that arrives in different formats, at different intervals, and with different levels of detail. Documenting the time period, included locations, suppliers, and categories at the beginning makes later comparisons more reliable.
Standardize Products, Suppliers, and Units of Measure
Raw purchasing data is messy. One supplier may list a product by brand name, another by a shortened description, and a third by an internal item code. The same supplier may appear under several names. Units of measure can vary between cases, pounds, eaches, or sleeves.
Standardization brings those records into a common structure. Products need consistent descriptions and category assignments. Supplier names need to be normalized. Pack sizes and units of measure need to be aligned so comparisons are valid.
This step is easy to underestimate, but it determines the quality of everything that follows. Two products that look similar in a spreadsheet may not be comparable once specifications and pack sizes are considered. Clean data prevents false savings opportunities and misleading price comparisons.
Segment Spend by Location, Category, and Supplier
Once the data is standardized, divide it into views that answer specific business questions. Category segmentation can show which areas drive the most spend or inflation. Supplier segmentation can reveal concentration and fragmentation. Location segmentation can highlight differences in price, volume, and purchasing behavior.
Additional filters may include region, concept, ownership model, approved versus unapproved products, contracted versus non-contracted spend, and direct versus distributor purchases. The right segments depend on the operation and the decision at hand.
Analyze Purchasing and Pricing Patterns
Next, look for trends over time and differences across comparable groups. Review changes in average price, purchase volume, product mix, supplier use, and location behavior. Compare current performance with prior periods, budgets, contracts, and relevant internal benchmarks.
This is also the point to separate price effects from usage effects. If chicken spend increased, did the delivered price rise, did restaurants buy more cases, or did they shift into a more expensive specification? Each cause requires a different response.
Patterns matter more than isolated numbers. A single substitution may reflect a short-term stock issue. Repeated substitutions across a region could signal a supply problem, a specification issue, or a gap in location-level compliance.
Identify Spend Variances
A spend variance is a difference between actual purchasing activity and an expected price, product, volume, contract term, or performance level. Variances can be found across locations, suppliers, time periods, or comparable items.
Not every variance represents recoverable savings. Some result from freight, geography, product availability, local regulations, or operational needs. The best analysis pairs the size and frequency of a variance with the business context behind it.
Teams should quantify potential impact, validate the cause, assign ownership, and track the outcome. Otherwise, spend analysis becomes an interesting report that never changes how the organization buys.
Common Foodservice Spend Analysis Challenges
Most operators have plenty of purchasing data. The challenge is turning it into information they can trust and use. Four issues tend to make that harder.
Fragmented Purchasing Data
Purchasing information may be split across broadline distributors, specialty suppliers, local vendors, accounting systems, and spreadsheets maintained by individual teams. Different reporting schedules and formats make it difficult to create a complete view.
Fragmentation can also leave decision-makers working from different versions of the truth. Procurement may use distributor reports while finance relies on paid invoices and operations tracks a separate location file. Consolidating the data creates a shared starting point.
Inconsistent Product and Supplier Data
Inconsistent names, product descriptions, item numbers, categories, and pack sizes make matching and comparison difficult. If the same product appears as several unrelated records, total volume may be understated, and supplier leverage may be missed.
Automated classification can speed up the work, but foodservice knowledge still matters. Product specifications are nuanced, and a cheaper item is not automatically an acceptable equivalent. Reliable spend analysis must preserve the operational detail behind the numbers.
Missing or Incomplete Transaction Data
Missing invoice lines, credits, fees, locations, or supplier files can distort the result. A category may appear to decline simply because one supplier did not submit data for part of the period.
Before drawing conclusions, teams should check data completeness and reconcile totals against financial records or supplier statements. It is better to label a known gap than to present an incomplete number as a fact.
Limited Visibility Across Locations
Multi-unit operators may have strong enterprise contracts but limited visibility into what each restaurant actually purchases. Franchise structures, local buying authority, manual invoice processes, and regional supplier differences can make systemwide analysis difficult.
Without location-level detail, teams can see that costs are changing but may not be able to pinpoint where or why. A spend analysis platform that connects enterprise and unit-level activity makes it easier to identify the locations, items, and transactions behind the trend.
How to Turn Spend Insights Into Cost Savings
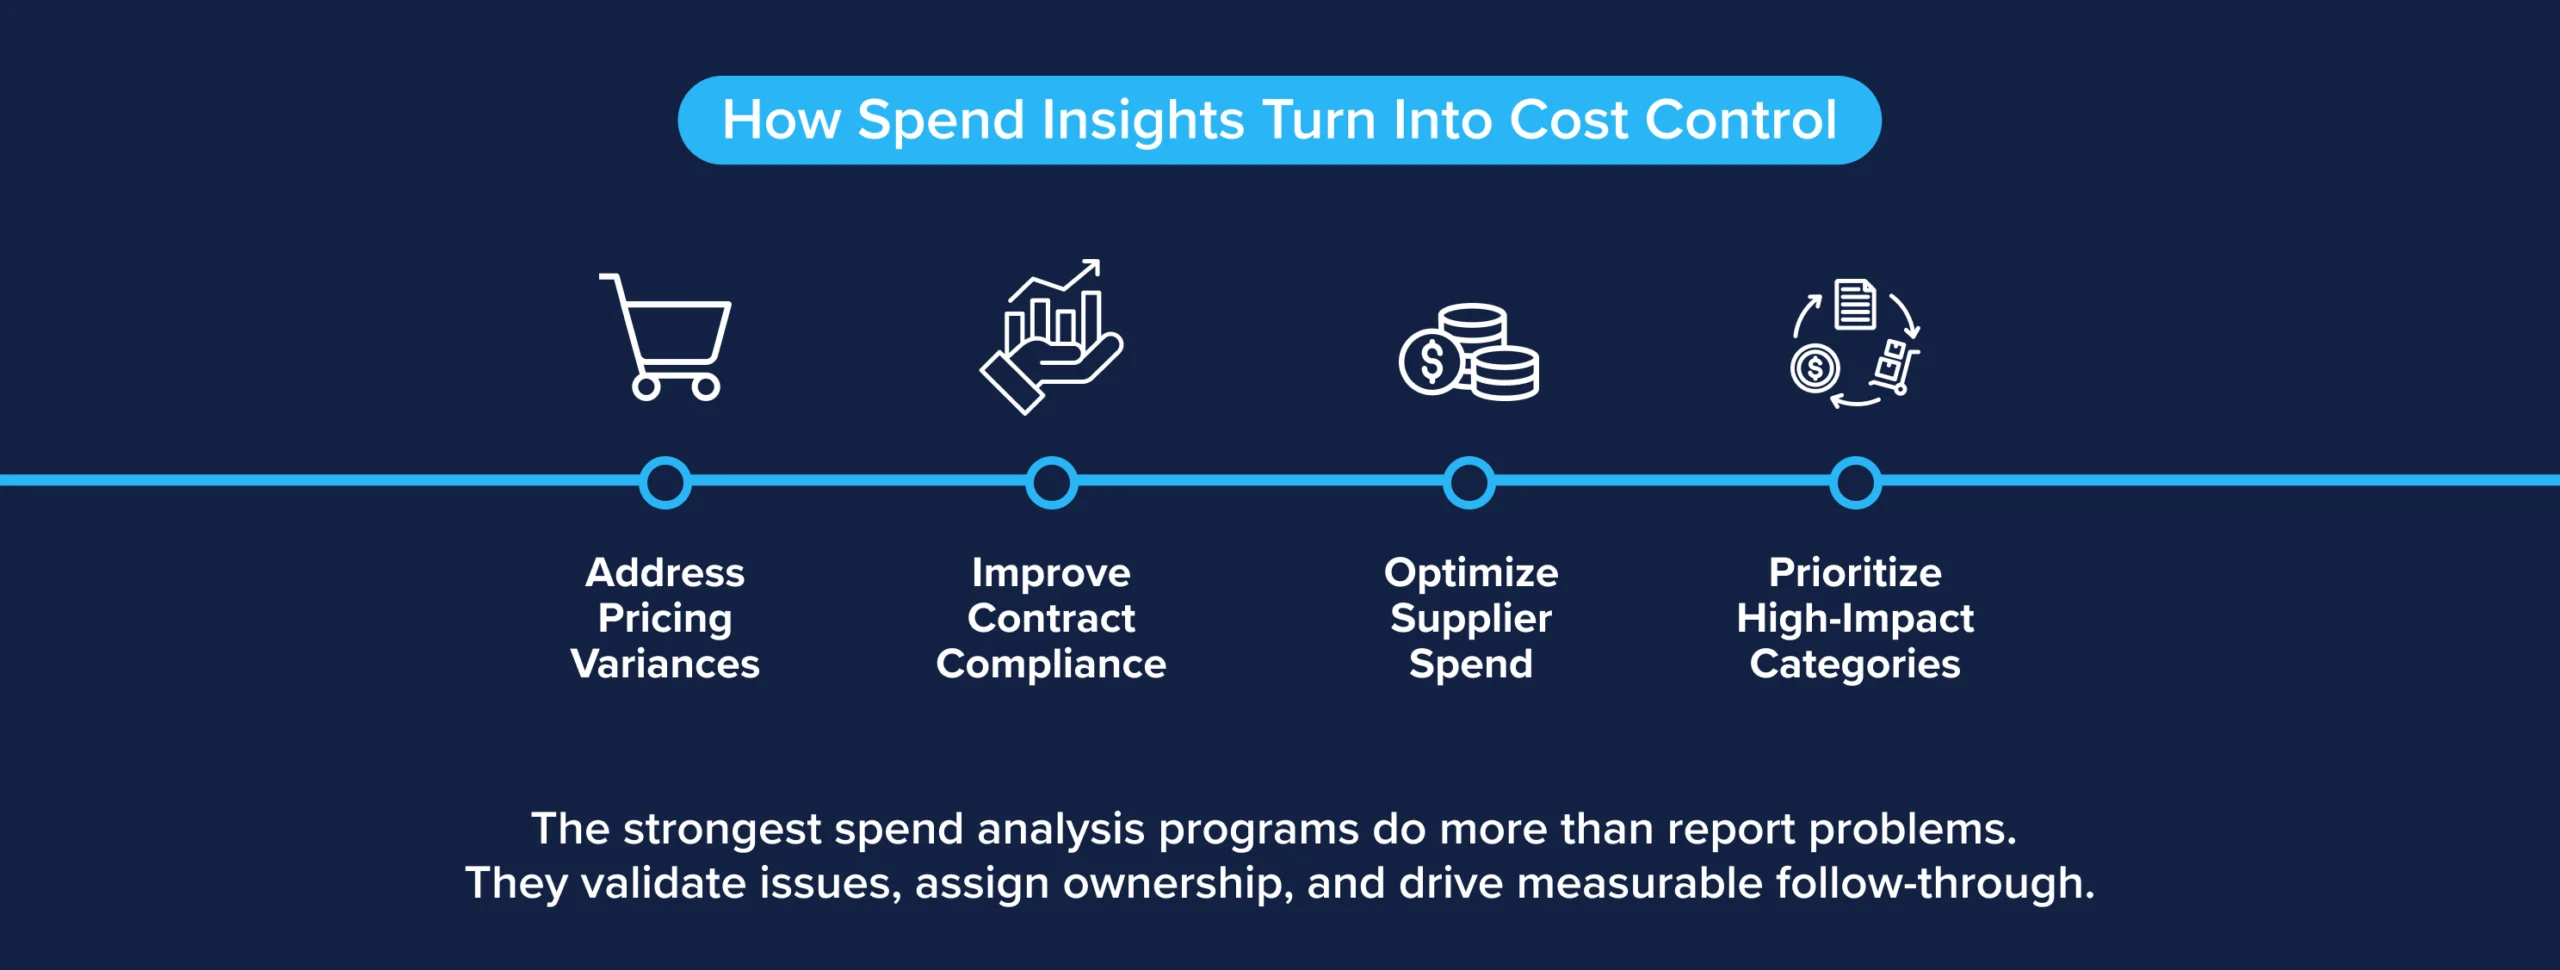
Spend analysis creates value when it leads to action. The most effective programs build a repeatable process around reviewing findings, validating opportunities, assigning next steps, and measuring results.
Address Pricing Variances
Begin with material differences between expected and actual prices. Confirm that the products, quantities, pack sizes, delivery dates, and contract periods are comparable. Then determine whether the variance reflects a billing issue, an outdated agreement, a missed allowance, an approved market adjustment, or another cause.
Validated discrepancies can be addressed with the supplier or distributor. Just as important, recurring variance patterns can point to a process issue that needs a broader fix.
Improve Contract Compliance
Spend analysis can show where locations are purchasing non-contracted products, using unapproved suppliers, or substituting items outside established specifications. That visibility helps operators distinguish between avoidable noncompliance and legitimate exceptions caused by outages, local needs, or menu requirements.
The response should go beyond telling locations to follow the contract. Teams need to understand whether approved products are available, whether item information is clear, and whether the contracted option works in the operation. Compliance improves when the purchasing program is practical as well as well negotiated.
Optimize Supplier Spend
Supplier-level analysis can uncover fragmented spend, overlapping relationships, and categories that may benefit from consolidation or competitive sourcing. It can also reveal overreliance on a single source, which may create supply continuity risk.
Optimization does not always mean reducing the supplier count. The right mix balances cost, coverage, service, quality, and resilience. Spend analysis provides the facts needed to evaluate those tradeoffs instead of defaulting to price alone.
Prioritize High-Impact Categories
Procurement teams rarely have the capacity to address every opportunity at once. Prioritize categories using a combination of total spend, price movement, contract status, savings potential, operational importance, and supply risk.
A modest percentage improvement in a high-spend category can have a larger effect than a dramatic reduction in a category the organization barely buys. Category prioritization keeps sourcing and cost-control efforts connected to real financial impact.
How Technology Improves Foodservice Spend Analysis
Spreadsheets can support a one-time review, but they become difficult to maintain as supplier, item, invoice, and location counts grow. Manual processes also consume the time procurement teams could spend validating opportunities and working with stakeholders.
Technology improves spend analysis by automating data collection, normalization, classification, and reporting. A centralized platform can bring together purchasing information from multiple distributors and suppliers, match products and locations, monitor contract performance, and surface exceptions that warrant attention.
The greatest benefit is not simply faster reporting. It is the ability to move from periodic snapshots to ongoing visibility. Teams can monitor changes, investigate individual transactions, compare locations, and track whether corrective action produces the expected result.
ArrowStream helps restaurant supply chain teams turn complex purchasing data into practical intelligence. Its foodservice-focused technology connects spend visibility with contract management, price auditing, sourcing, and supplier collaboration, giving operators a clearer view of what they buy and how those purchases perform. Rather than asking teams to sort through disconnected reports, ArrowStream helps them focus on the exceptions and opportunities that can make a measurable difference.
Technology still does not replace judgment. A platform can flag a price variance or a shift in supplier spend, but experienced teams determine why it happened and what action makes sense. The strongest approach combines dependable data, foodservice expertise, and disciplined follow-through.
How Often Should Foodservice Operators Analyze Spend?
Foodservice operators should monitor spend regularly and conduct deeper reviews at intervals that match their purchasing cycle, category volatility, and business priorities.
Monthly analysis is a practical baseline for many organizations. It allows teams to review price and volume changes, contract compliance, supplier activity, and location exceptions while the underlying transactions are still recent. High-spend or volatile categories may require weekly monitoring, particularly when markets are changing quickly or a new contract is being implemented.
Quarterly reviews are useful for broader category planning, supplier performance discussions, budgeting, and sourcing decisions. Annual analysis can support strategic planning, but it should not be the only time an operator looks closely at spend. Waiting a full year can allow preventable variances to accumulate.
Operators should also run targeted spend analysis before a contract renewal, sourcing event, menu change, acquisition, supplier transition, or major budgeting cycle. In those moments, current and well-organized data creates negotiating leverage and reduces guesswork.
The best cadence is one the organization can act on consistently. A weekly report has little value if no one reviews the exceptions. A monthly process with clear ownership and follow-up can be far more effective.
Key Takeaways
Spend analysis gives foodservice operators a detailed view of how purchasing decisions affect cost, contract performance, and supplier strategy. It helps teams move beyond total-spend reporting to understand the items, transactions, locations, and behaviors behind the numbers.
Reliable analysis starts with complete data and careful standardization. From there, operators can segment spend, examine patterns, investigate variances, and prioritize the opportunities with the greatest potential impact.
The final step is action. Pricing discrepancies need validation. Compliance gaps need context. Supplier and category opportunities need owners, timelines, and measurable outcomes. With the right process and technology, spend analysis becomes more than a report. It becomes an ongoing discipline for protecting margins and strengthening purchasing performance.
ArrowStream gives restaurant supply chain teams the visibility and foodservice intelligence needed to put spend data to work. Learn more about how ArrowStream can help your organization uncover opportunities, improve contract performance, and make more confident purchasing decisions.
FAQs
What Is Spend Analysis?
Spend analysis is the process of collecting, cleaning, classifying, and evaluating purchasing data to understand what an organization buys, how much it spends, which suppliers receive that spend, and whether purchases align with contracts and business goals.
Why Is Spend Analysis Important for Restaurants?
Spend analysis helps restaurants identify price differences, off-contract purchases, inconsistent buying behavior, supplier fragmentation, and category trends. For multi-unit operators, it also provides visibility into how purchasing performance differs across locations, helping teams focus cost-control efforts where they can have the greatest effect.
How Do You Conduct a Foodservice Spend Analysis?
Begin by collecting purchasing data from suppliers, invoices, accounts payable systems, contracts, and other relevant sources. Consolidate and standardize the records, segment spend by category, supplier, and location, then analyze price, volume, product mix, compliance, and purchasing patterns. Validate material variances before assigning actions and estimating savings.
What Data Is Needed for Spend Analysis?
A foodservice spend analysis typically uses product descriptions and item numbers, categories, supplier names, location identifiers, invoice dates, quantities, units of measure, pack sizes, unit prices, extended spend, credits, fees, contract terms, and approved product information. Complete transaction-level data produces the most useful results.
What Can Spend Analysis Reveal About Suppliers?
Spend analysis can show how much business is placed with each supplier, which categories they serve, how prices and volumes change over time, and whether purchases align with negotiated programs. It may also uncover fragmented spend, duplicate relationships, pricing variances, or concentration risk that deserves further review.
How Does Spend Analysis Identify Cost Savings?
Spend analysis identifies potential savings by comparing actual purchases with contracts, approved products, historical performance, and comparable locations or suppliers. It can reveal pricing discrepancies, noncompliant purchases, unnecessary product variation, fragmented supplier spend, and high-impact categories that may benefit from sourcing or negotiation. Each opportunity should be validated for product equivalency, operational feasibility, and market conditions before savings are counted.